How WAV data contributed to Wisconsin’s 2024 Water Condition Lists
By: Katy Bradford, WAV Program Manager, and Lily Butler, WAV and AIS Programs Student Assistant
Thanks in part to the hard work of our stream monitoring volunteers across the state, the Wisconsin DNR just released its draft 2024 Water Condition Lists. Every 2 years, the Wisconsin Department of Natural Resources (DNR) is required to assess the health or “condition” of the state’s surface waters – including lakes, rivers and streams – as required by the U.S. Clean Water Act. Water quality data for assessing the state’s waters is provided by DNR biologists, county conservation staff, university researchers, and of course, stream and lake monitoring volunteers! The final 2024 Water Condition List will be submitted to the U.S. Environmental Protection Agency (EPA) in April.
Why is this important? Regularly assessing Wisconsin’s water quality against specific criteria allows us to protect and restore our waters by setting goals for addressing known water quality issues.
So how healthy are Wisconsin’s waters overall?
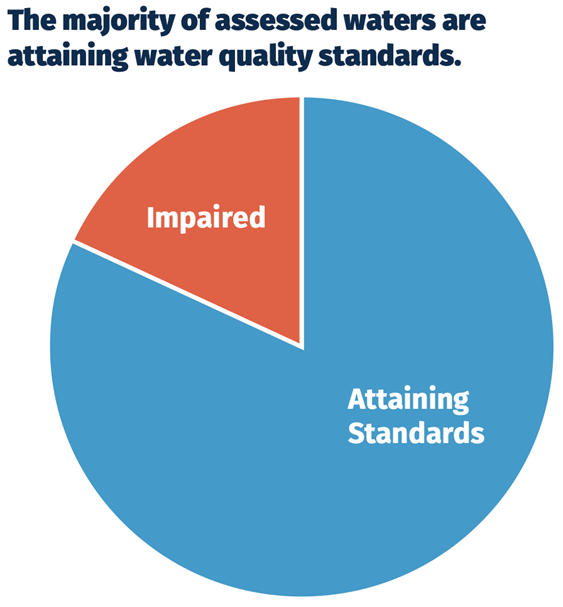
- Good news – over 80% of Wisconsin’s waters that were assessed for water quality are meeting state criteria!
- Only 18% of Wisconsin’s waters are not meeting state criteria and are listed as “impaired” or “in restoration”. Impaired waters in Wisconsin are waters that do not meet one or more water quality standards and may not support fishing, swimming and recreation, aquatic life, or public health and welfare.
- Total phosphorus is the most common pollutant affecting water quality in Wisconsin’s waters. Waters were also listed this year for degraded aquatic plant communities and chlorophyll (algae) in lakes, which are often related to high nutrient levels. Other waters are listed for elevated bacteria, metals or toxins, or degraded habitat or biology.
Stories highlight WAV volunteers’ contributions
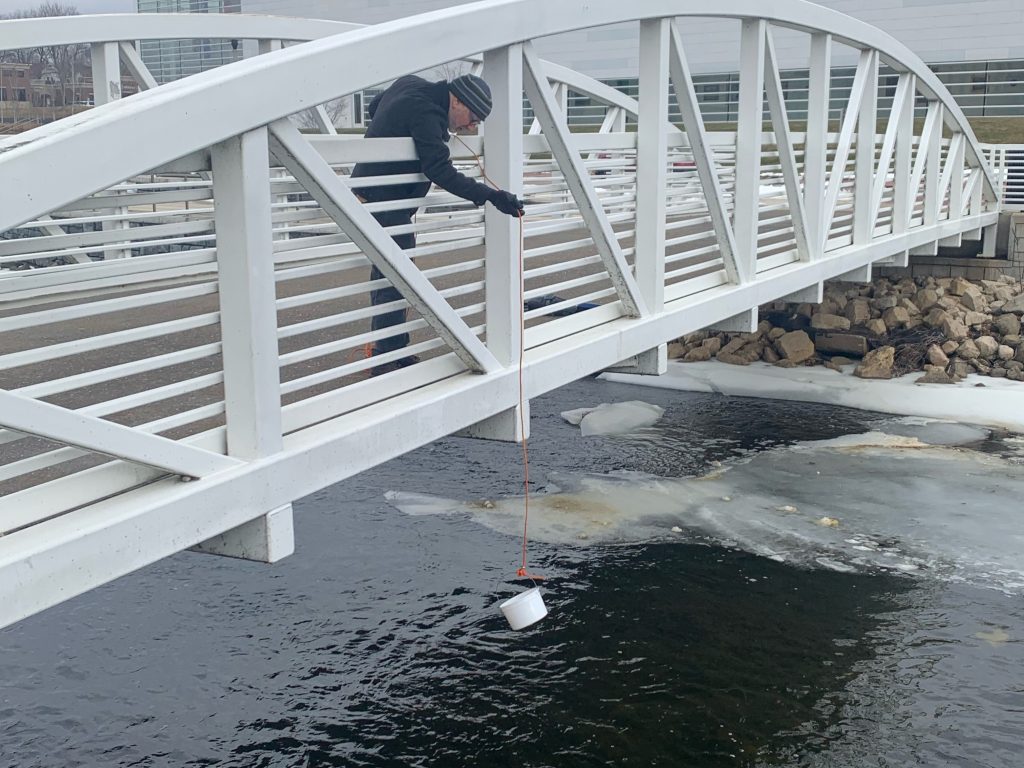
WAV nutrient data can help DNR biologists understand the ecological state of a river or stream and help them decide whether to list it as healthy or impaired. Dave Bolha, a DNR stream biologist in central Wisconsin, says that one of the roles that WAV volunteers play in the establishment of the Water Condition Lists is to collect Total Phosphorus (TP) data in areas where the DNR does not expect a problem. Volunteer nutrient monitoring data can reaffirm the healthy status of a river, often in places where data has not been collected before.
One of the best examples of this, Dave explained, is Flume Creek (WBIC 286600) in central Wisconsin where WAV volunteer Tom Janssen (pictured) recently collected nutrient samples. In the summers of 2022 and 2023, Tom collected samples at 6 sites on the creek for one of Dave’s monitoring projects. The samples from two of those sites, Drake Road and Hwy 66, confirmed that the phosphorus level in the stream meets the state’s criteria for the pollutant. Tom traveled about 250 miles roundtrip each month to collect this data, and it has proven to be extremely valuable information for future stream management and planning!
In another part of the state, Craig Helker, a DNR water resources biologist in southeast Wisconsin, explained how stream monitoring volunteers with Milwaukee Riverkeeper, a WAV partner, had a significant role in collecting data for the 2024 Water Condition List. In Milwaukee County alone, volunteers provided data to justify the addition of pollutants of concern to six waterbodies. Furthermore, their efforts allowed the DNR to reaffirm existing impairments on local waters and remove or “delist” pollutants of concern for three waterbodies.
For example, data collected by WAV volunteers on the Kinnickinnic River and its tributary Wilson Park Creek, which are already listed as impaired waters, confirmed continued total phosphorus and chloride exceedances and suggested adding E. coli (bacteria) as a new pollutant impacting these heavily urbanized waterbodies. A 2007 article titled “The Lost River” in Milwaukee Magazine highlighted the water quality challenges for the Kinnickinnic River and its tributaries. Since then, the Milwaukee Metropolitan Sewerage District, Milwaukee County Parks, Army Corps of Engineers, Milwaukee Riverkeeper, Wisconsin DNR, and many others have continued their work to repair this river. Volunteer and professional data alike have served as impetus for this important work, and in the case of the Kinnickinnic River and its tributaries, will help document future successes.
While WAV’s nutrient monitoring program directly contributes data used in impaired waters assessments, long-term volunteer baseline data on water temperature, dissolved oxygen, transparency/turbidity and biotic index provide important indicators of stream health that can demonstrate when there’s a need for additional testing for water quality pollutants.
How you can help and learn more
- Are you interested in helping collect total phosphorus water samples at a stream location in your local watershed? Contact your local WAV Coordinator to learn about opportunities to participate in WAV’s nutrient monitoring program.
- Wondering what these “nutrients” are that we are talking about, and where these water quality pollutants may come from? Read our blog post on “Nutrient monitoring in Wisconsin’s waters: What does it all mean?”