
Macroinvertebrates as Metrics: A Deeper Dive into Biotic Index Calculations
By: Mike Miller, Stream Ecologist, Wisconsin DNR
In 1972, The Federal Water Pollution Control Act Amendments (aka “The Clean Water Act”) established a framework for protecting water quality and regulating pollution discharges to the nation’s waters. The act resulted in extensive water quality testing of lakes, streams, and rivers that has been largely successful in assessing and improving the ecological conditions of the Nation’s water resources. With good control of point source pollution in the U.S. (e.g. pipes discharging into streams), today’s threats to streams are more strongly associated with changes in land use, climate change, and more diffuse and dynamic sources of polluted runoff.
As a result, since the 1980s there has been an increasingly greater reliance on using the plants and animals found in aquatic ecosystems as biological indicators of environmental health, as they respond to the influences of multiple environmental stressors that vary in space and time. These types of measurements are called biotic indexes.
How can we use a biotic index to measure stream health?
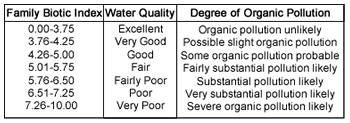
Biotic indexes are useful tools for evaluating whether streams are degraded by organic pollution from agricultural and urban runoff. Organic pollution can include manure, fertilizers dissolved in the water and in the sediments, and wastewater. When this organic pollution decomposes in the stream, it reduces the oxygen available for aquatic life. Biotic indexes analyze how many and what types of organisms (e.g. macroinvertebrates or fish) are present in bodies of water since each organism, or aquatic biological indicator, may have varying sensitivities to pollutants. These indexes, however, do not necessarily assess other types of environmental impacts to streams, such as heavy metals, pesticides, excess sediment, or greater streamflows from extreme storm events that damage stream habitat and disrupt aquatic life.
In the 1980s, Professor William Hilsenhoff, an entomologist at UW-Madison, identified aquatic invertebrates in Wisconsin streams along a range of nutrient concentrations, such as phosphorus and nitrogen, and associated dissolved oxygen levels. He used his findings to develop the Hilsenhoff Biotic Index (HBI). The HBI is still used today by biologists in Wisconsin and, with modifications, across the U.S. and in other countries. The Water Action Volunteers (WAV) index is largely based on Hilsenhoff’s work.
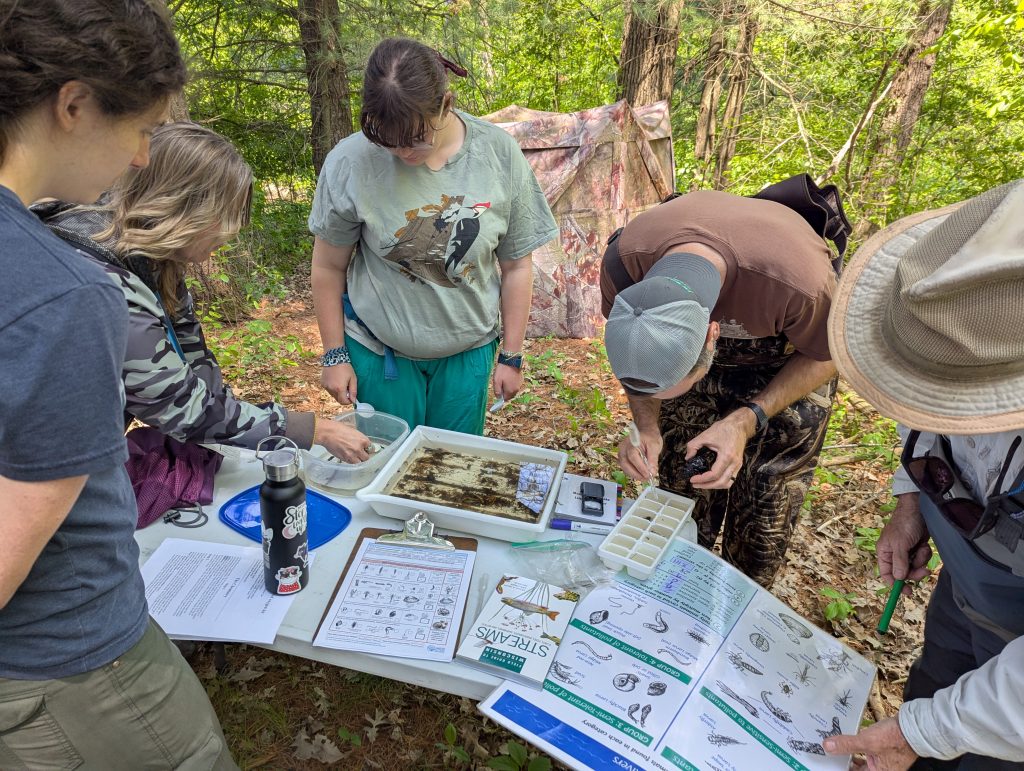
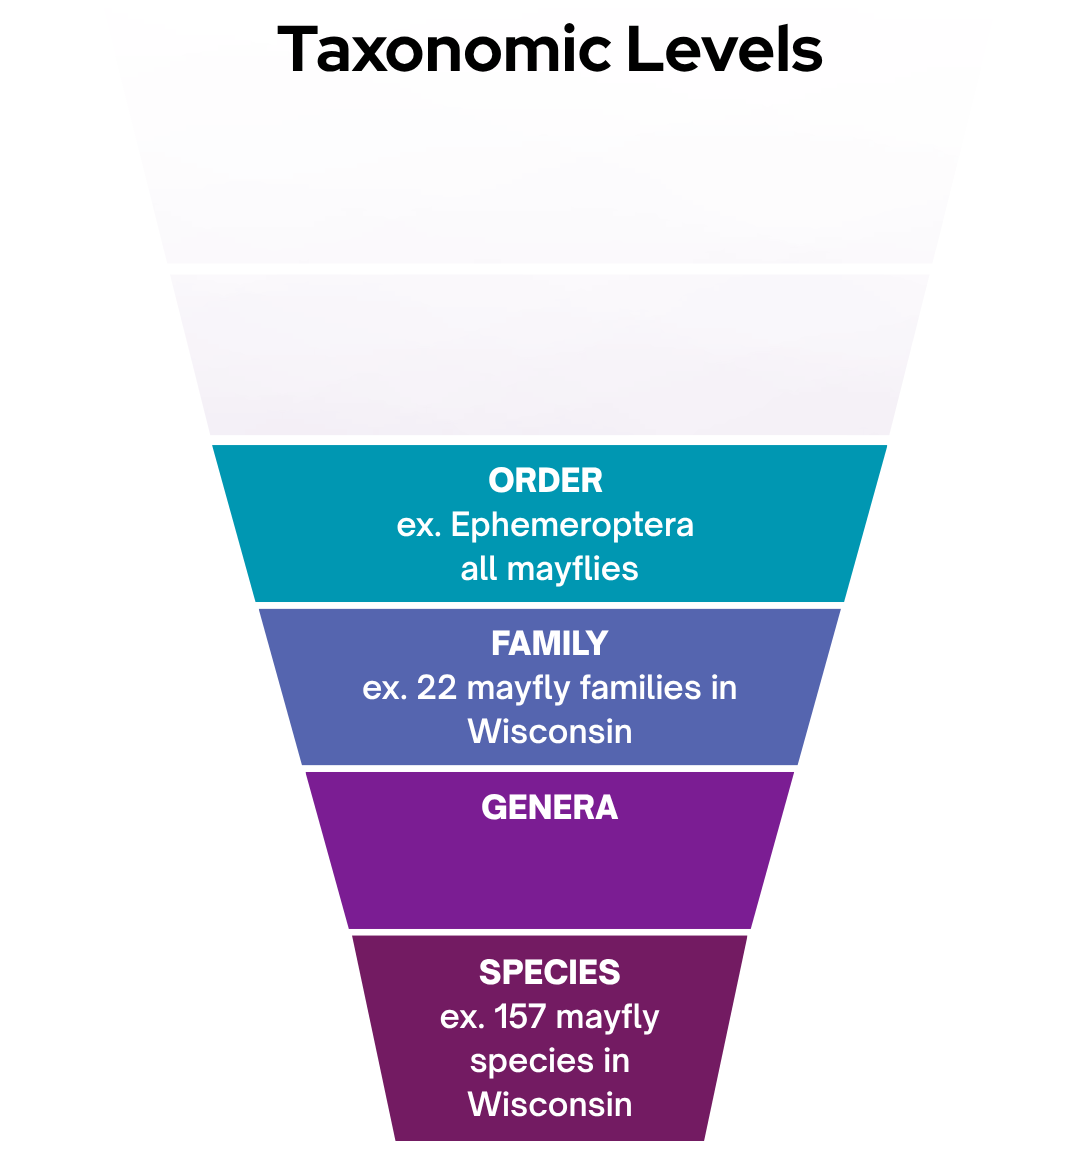
For the HBI, scientists randomly collect/sample over 250 individual invertebrate specimens from a stream. Specimens are identified to the lowest taxonomic level practical, typically genus or species. These identifications are done in a laboratory by professional taxonomists. In contrast, calculating WAV index scores relies on determining aquatic invertebrates at a broader level: orders (e.g. mayflies, stoneflies, caddisflies). This can be done streamside by volunteers.
Knowing a stream supports mayflies (which are generally environmentally sensitive animals) is not as precise as identifying and quantifying the number and proportions of different mayfly species (and species of other orders) inhabiting a stream, since the environmental tolerances of aquatic invertebrates can vary significantly within orders.
Caddisfly families have different levels of tolerance to pollution
It is also useful to study invertebrate family levels. For that, let’s look at the caddisfly (order Trichoptera).
Caddisfly families can be identified by the shapes and materials they use to build their larval cases, or, in the case of “free-living” caddisfly families, by the lack of case-building. By examining the caddisflies to the family level, we can gather information for a more precise assessment of a stream’s health based on the differing caddisfly families ecologies and environmental sensitivities. Here are some examples:
Case-Building Caddisfly Families
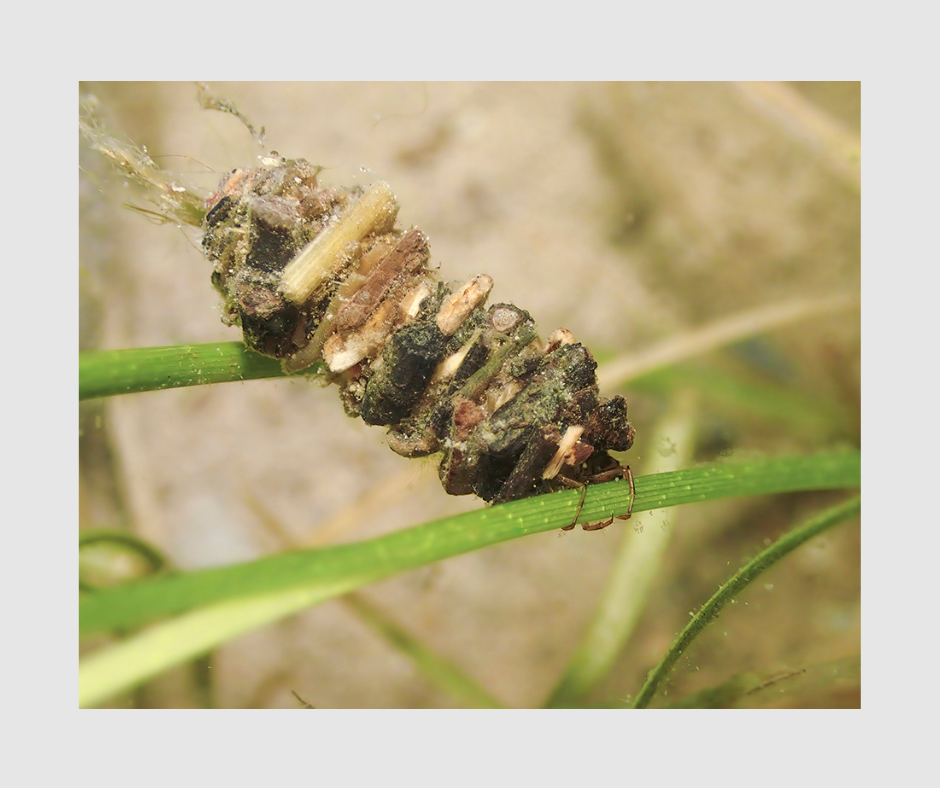
The “Northern Casemaker” caddisflies in the family Limnephilidae are known for their diverse use of case materials, including sticks, gravel, and debris. They are quite common in Wisconsin and are very sensitive to organic pollution.
Pollution Tolerance
Upper Midwest: 1 – 2
0 = least tolerant, 10 = most tolerant

The caddisfly family Brachycentridae build a 10 mm-long case out of plant material that looks like a house chimney (hence the common name “chimney case builders”). They are very sensitive to organic pollution.
Pollution Tolerance
Upper Midwest: 1
0 = least tolerant, 10 = most tolerant
The “giant case builder” caddisflies in the family Phryganeidae generally construct a larger case comprised of a mix of small stones and sand grains along with bits of woody material. They are more tolerant of organic pollution.
Pollution Tolerance
Upper Midwest: up to 5
0 = least tolerant, 10 = most tolerant
Check out this cool video to see how caddisfly larva use special silk to build their cases!
“Free-Living” Caddisfly Families
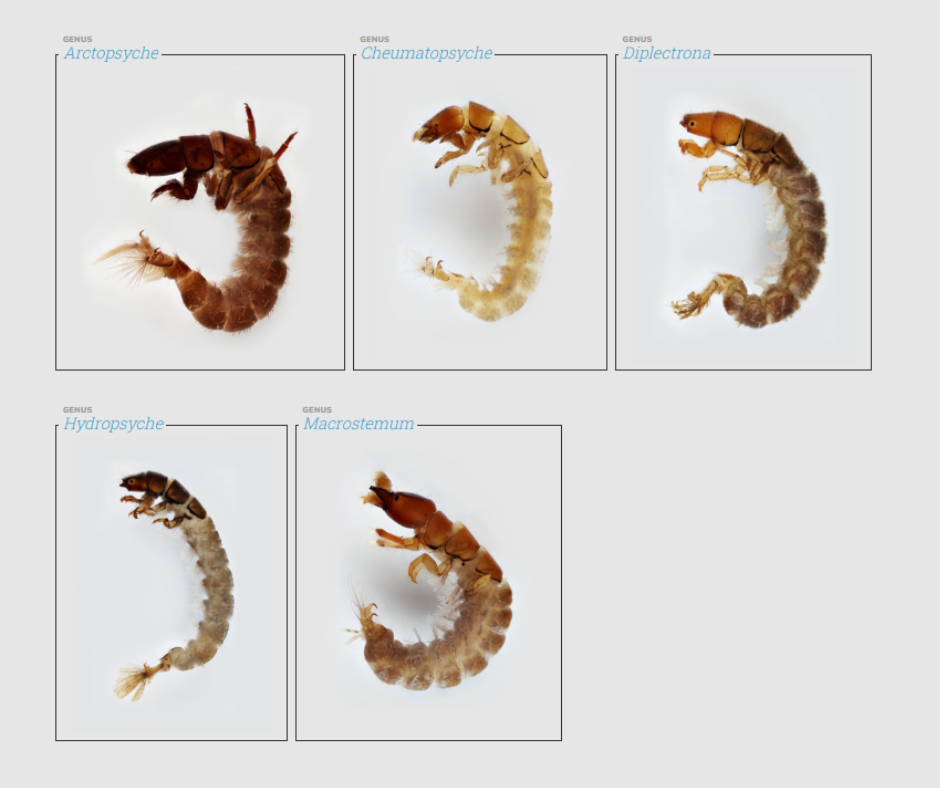
The free-living caddisflies in the family Hydropsychidae are quite common. They are generally dark green in color with a black head and thorax. They are moderately sensitive to organic pollution.
Pollution Tolerance
Upper Midwest: 2.6
0 = least tolerant, 10 = most tolerant
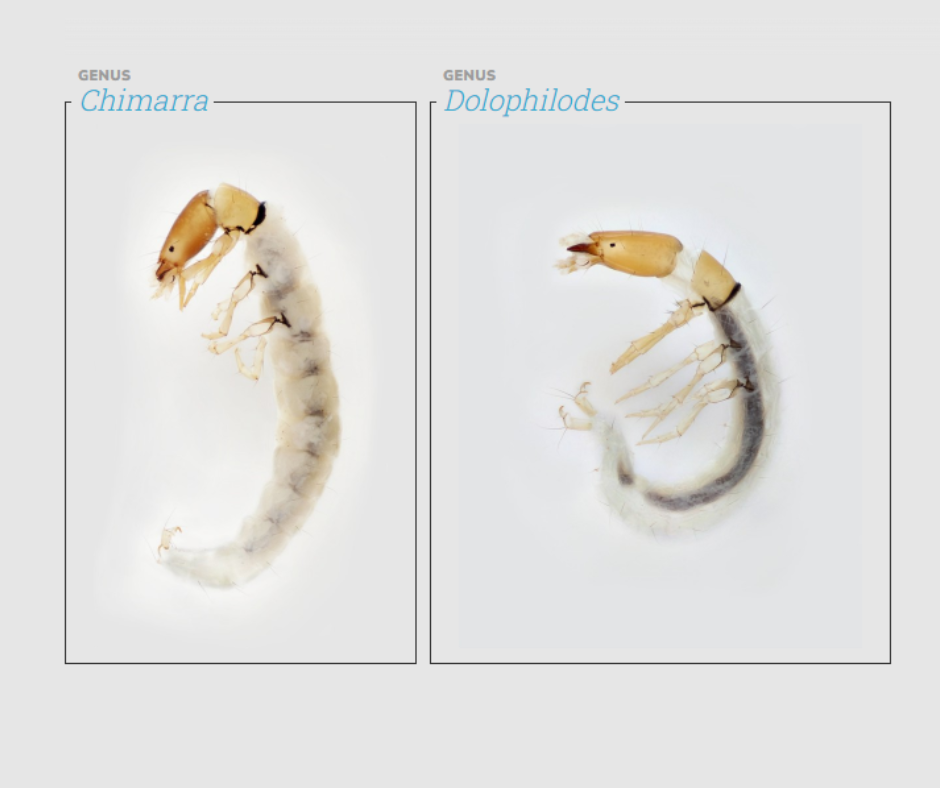
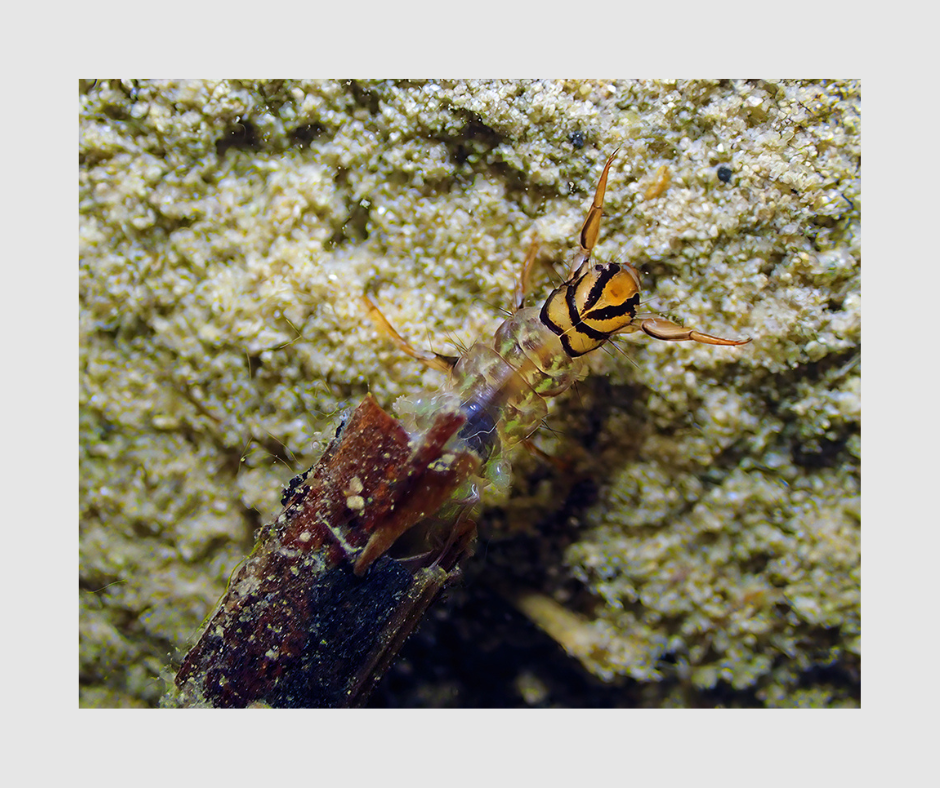
The family Philopotamidae, another caseless caddisfly, is distinguished by a uniquely-colored, orange body, and dark orange head. They are very sensitive to organic pollution.
Pollution Tolerance
Upper Midwest: up to 2.6
0 = least tolerant, 10 = most tolerant
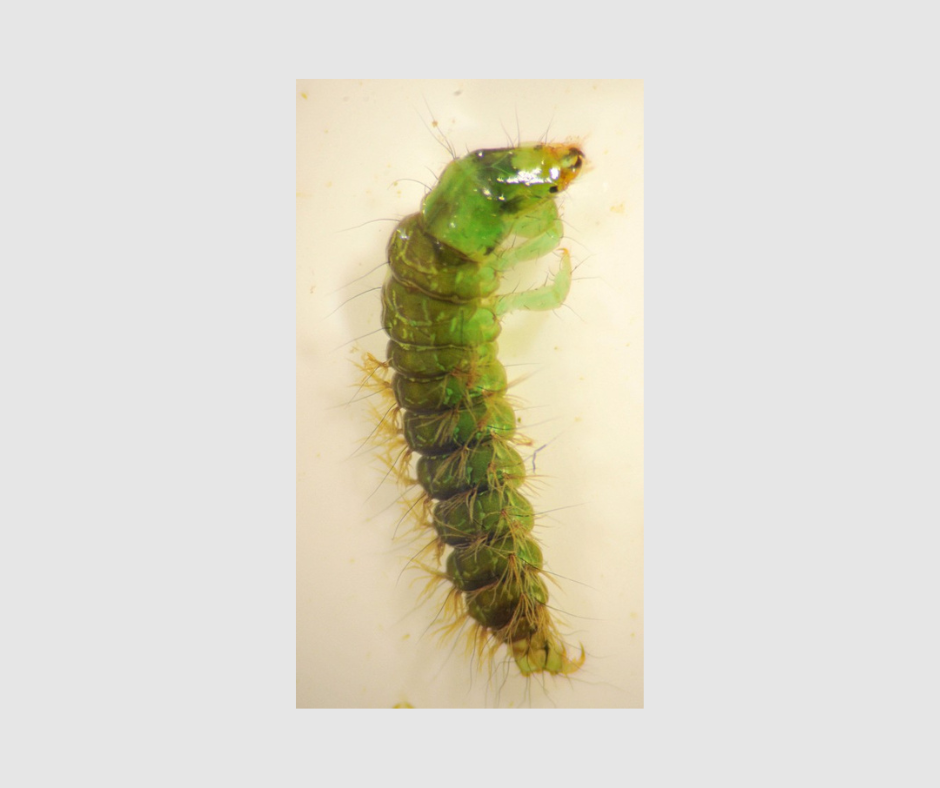
Lastly, the free-living family Rhyacophilidae (“green rock worm”) have a distinctly bright green (chartreuse) color. They are also very sensitive to organic pollution.
Pollution Tolerance
Upper Midwest: up to 0
0 = least tolerant, 10 = most tolerant
Summary
The more we know about streams, their inhabitants, and what affects them, the better we can advocate for their protection, along with making our time a field a richer experience as we explore these watery jewels of the Wisconsin landscape. Biotic indexes are useful tools for evaluating whether streams are degraded by organic pollution from agricultural and urban runoff.
For volunteers interested in advancing their understanding of the ecology and health of their local waters, the WAV biotic index is a useful tool as it provides a framework for the assessment of stream health. Volunteers can further hone their ID skills and expand their knowledge of their stream’s health by studying certain groups of aquatic invertebrates, such as caddisflies or mayflies, at the family level.