
New! Explore WAV macroinvertebrate data on the WAV Dashboard
By Ben Bradford, WAV Dashboard manager and UW-Madison research scientist in Entomology
We are excited to now display volunteer macroinvertebrate data on the WAV Stream Data Dashboard, going back to 2015. In this blog post, we’ll show you a few ways you can learn about your stream by exploring the WAV Biotic Index data on the dashboard.
A quick review of the WAV Biotic Index method
As part of WAV’s baseline monitoring program, volunteers may collect and identify macroinvertebrates to help characterize the ecological community and general health of the stream. We ask volunteers to sample their stream twice a year, once in spring and once in fall.
- Animals are identified as present or absent in the stream.
- Animals are assigned to four groups based on how sensitive or tolerant they are to poor water quality.
- Volunteers also indicate if they suspect they found one of four target aquatic invasive species.
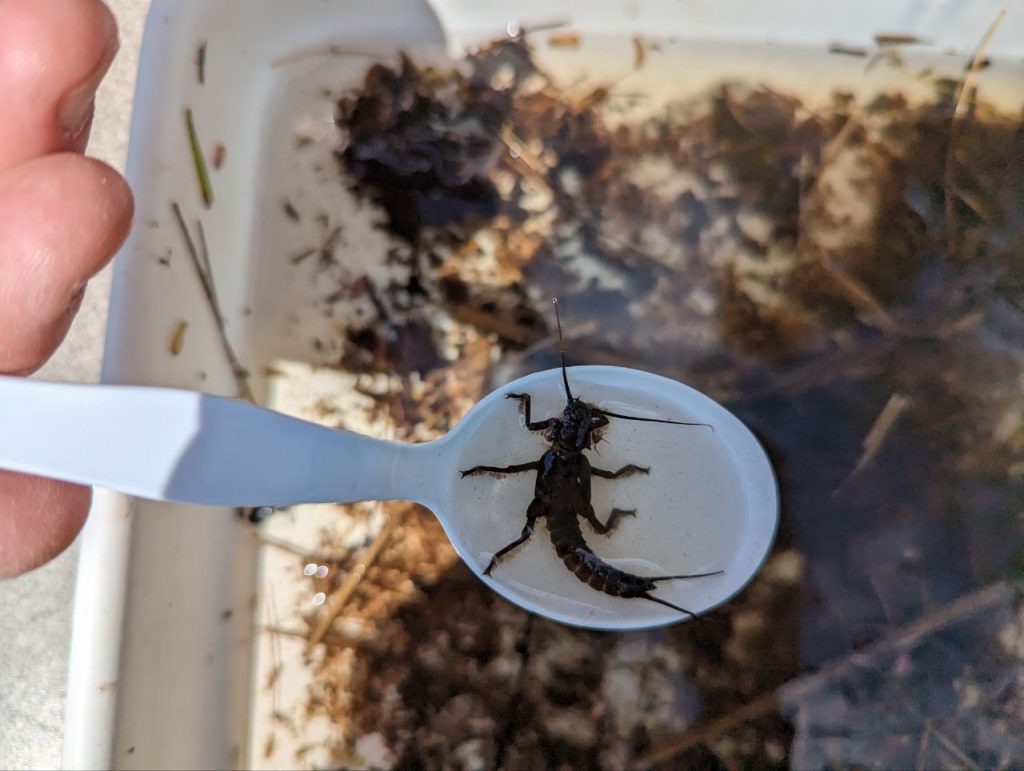
A volunteer holds a Giant stonefly during a biotic index.
The WAV Biotic Index final score consistently underrates the health of streams in Wisconsin, so it isn’t a perfect measure of stream health. But it is useful to observe which animals are found in the stream year after year.
Generally “sensitive” animals like stoneflies and dobsonflies are more likely to be found only in high-quality, high-oxygen, coldwater streams with low levels of pollution or disturbance. More “tolerant” species like snails or midge larvae are more likely to be found in both degraded and healthy streams.
Explore animal Presence or Absence over time
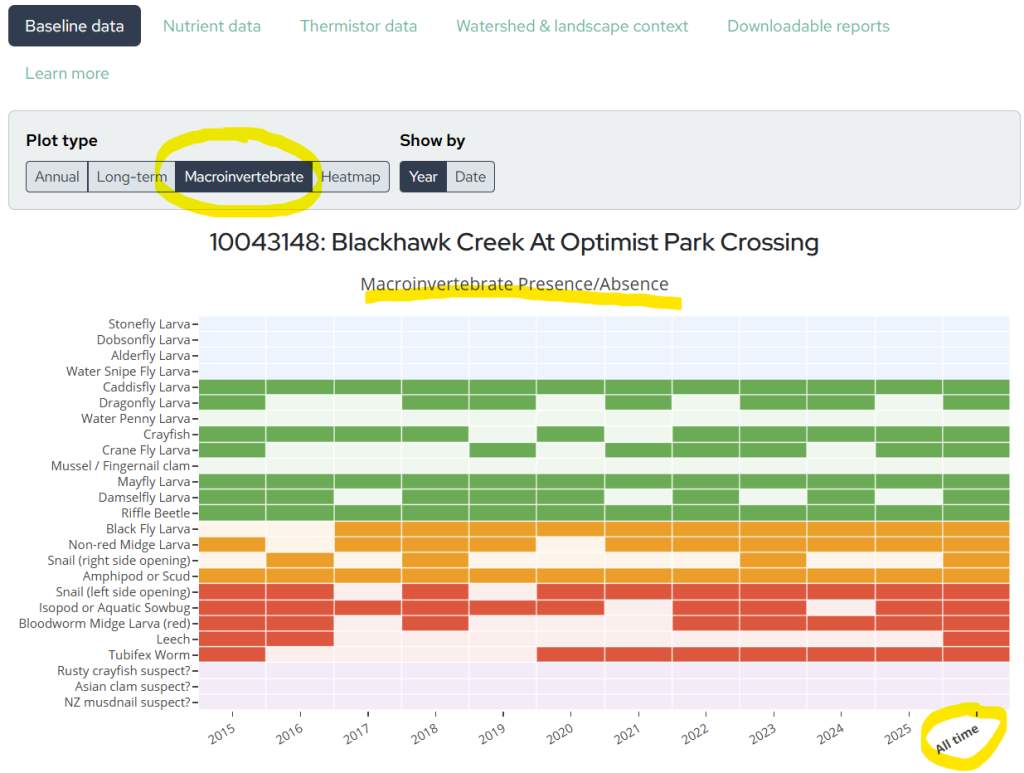
On the dashboard, you can find macroinvertebrate data under the Baseline data tab. If the station has any macroinvertebrate data, select the Plot type: Macroinvertebrate option to view a chart showing the Macroinvertebrate Presence/Absence of each animal, by Year or by Date.
- Tip: The final column in the chart, labeled All time, shows whether the animal was ever found at the stream site, looking at all years!
Explore the Biotic Index Score over time
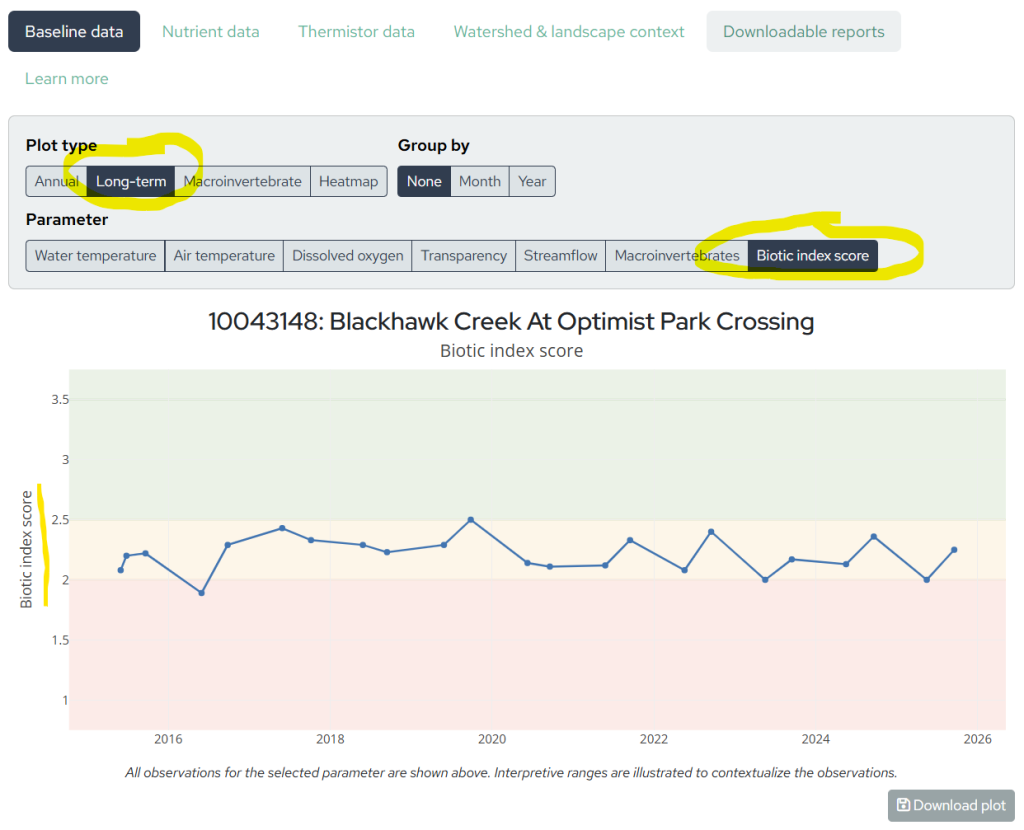
The WAV biotic index score is calculated as a weighted average of the total number of animals found in each group. This score is known to underrate high quality streams, so even a very healthy stream may not achieve a “Good” rating (2.6-3.5).
WAV staff are actively collaborating with the DNR and with Dr. Jessica Orlofske’s Lab at UW-Parkside to improve the WAV biotic index’s ability to indicate stream health.
To explore your stream’s biotic index score over time, select the Plot type: Long-term. The select the Parameter: Biotic index score.
Explore animal diversity over time
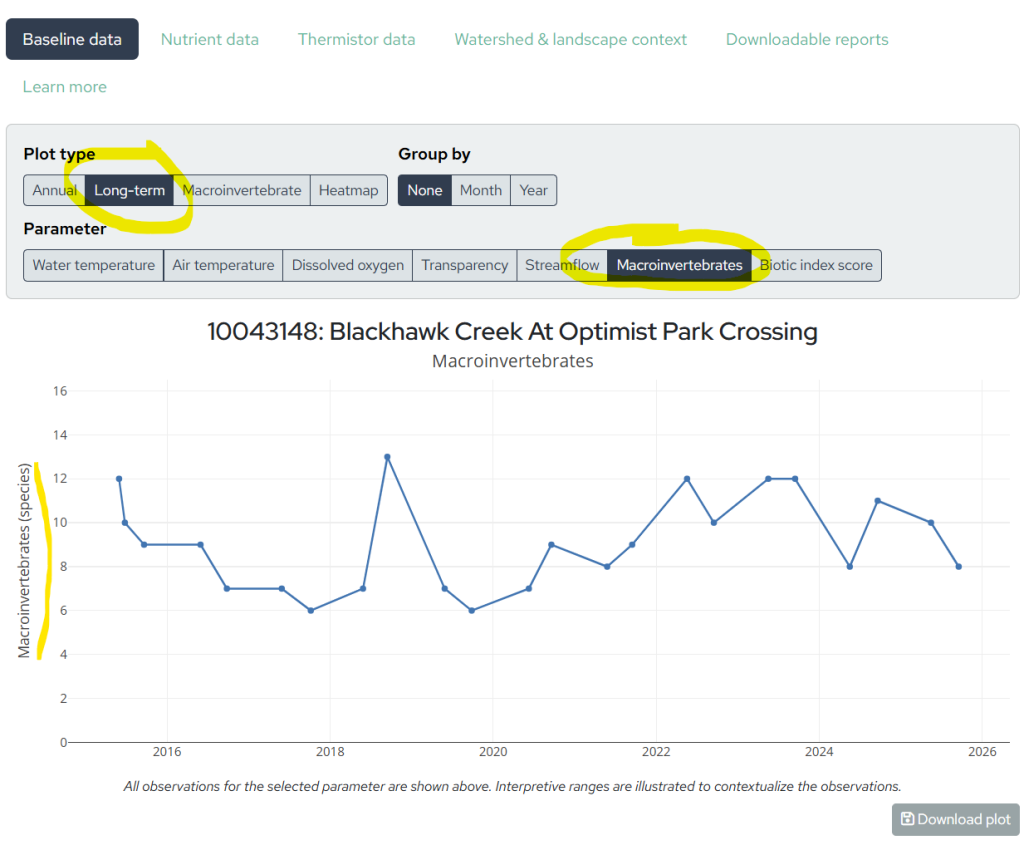
Are you interested in how many different animals were found at your stream site each year? We have a chart for that!
Having a greater diversity of animals in your sample is a good sign that your stream has many microhabitats that provide the right conditions for many different animals. Keep in mind that the number of animals found could be affected by stream conditions or by a volunteer’s sampling effort.
To explore your stream’s animal diversity over time, select the Plot type: Long-term. Then select the Parameter: Macroinvertebrates.
How to view and download all data for a stream site
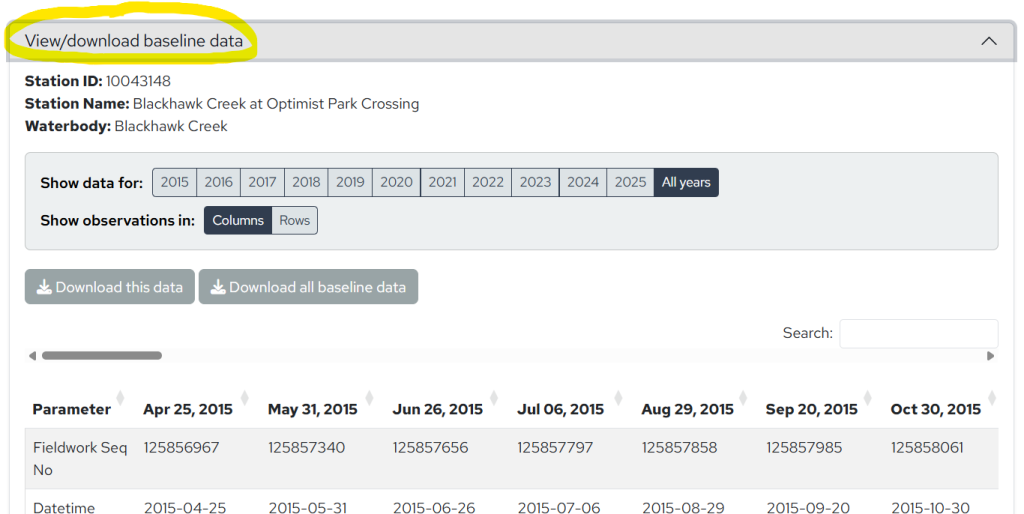
For those of you who want to see all baseline and macroinvertebrate data for a stream site in a spreadsheet, scroll all the way to the bottom of the dashboard and click on View/Download Baseline Data.
In this table view, you can scroll down to read volunteers’ fieldwork comments for each date to learn more about the stream conditions on the day they visited the site.
Select the years of data that you want to view and download to an excel spreadsheet.
How to edit incorrect data
If you discover a data entry error, log in to SWIMS and directly edit the data you submitted in the DNR database. Your changes will be reflected on WAV’s dashboard next month when we refresh the data.
Thank you for all of your efforts monitoring and observing the health of your local streams!